Crash signal
176
fewer crashes associated with a 10-cent higher gas price one month earlier
Analyzing Data...
CrashStory tested monthly Colorado crash counts against official Colorado gas prices. The strongest result is not “gas prices magically make roads safe.” It is narrower and more useful: after adjusting for seasonality and time trend, a 10-cent higher gas price one month earlier is associated with about 176 fewer crashes in the following month.
Crash signal
176
fewer crashes associated with a 10-cent higher gas price one month earlier
Injury signal
63
fewer injuries associated with the same 10-cent move
Typical month
10,097
average monthly Colorado crashes in the formal January 2023 to January 2026 window
Live coverage
593,392
Colorado crashes in CrashStory's live summary through 2026-02-26
In the formal model window from January 2023 through January 2026, Colorado’s lagged model points to fewer crashes and fewer injuries when gas gets more expensive.
A 10-cent higher gas price one month earlier is associated with roughly 176 fewer crashes and 63 fewer injuries in the next month. The fatality model also points negative, but because fatalities are much rarer and more volatile, that estimate is treated as directional rather than headline-safe.
This is still an association, not proof that higher gas prices directly cause fewer crashes. But it is a meaningful enough pattern to say that expensive fuel appears to reduce road exposure or trip volume enough to show up in crash counts.
Crashes
1.74% of a typical monthAverage month: 10,097. Modeled change from a 10-cent higher gas price one month earlier: 176 fewer.
Injuries
2.00% of a typical monthAverage month: 3,153. Modeled change from a 10-cent higher gas price one month earlier: 63 fewer.
Fatalities
3.32% of a typical monthAverage month: 70.8. Modeled change from a 10-cent higher gas price one month earlier: 2.4 fewer.
If you split the lagged-price months into a low-price quartile and a high-price quartile, the high-price months actually show more raw crashes on average, not fewer.
Bottom-price months in this window average 9,773.3 crashes. Top-price months average 10,434.6.
That does not kill the hypothesis. It shows why seasonality matters. Higher gas months often line up with spring and summer travel months when road exposure is higher. That is why the adjusted models and year-over-year views matter more than a raw “high gas vs low gas” split.
This is an unadjusted split. It is useful for showing why raw comparisons can mislead, because high-gas months also tend to land in higher-travel spring and summer periods.
CrashStory’s public monthly series currently exposes the most recent 60 months, from April 2021 through February 2026.
The monthly crash level steps up sharply in 2023. Before 2023, the public series averages about 1,486.8 crashes per month. From 2023 onward, it averages about 9,953.4.
Mixing those two regimes would blur the analysis, so the formal models use the cleaner post-break window from January 2023 through January 2026.
These charts answer different questions. One shows scale, one shows the cleaner year-over-year relationship, one shows the raw series, and one shows why Colorado gas should be compared with Colorado crashes rather than a generic U.S. price line.

How big the modeled effect is
This is the simplest magnitude chart on the page. It translates the model into the size of a typical month so the estimate is easier to understand.
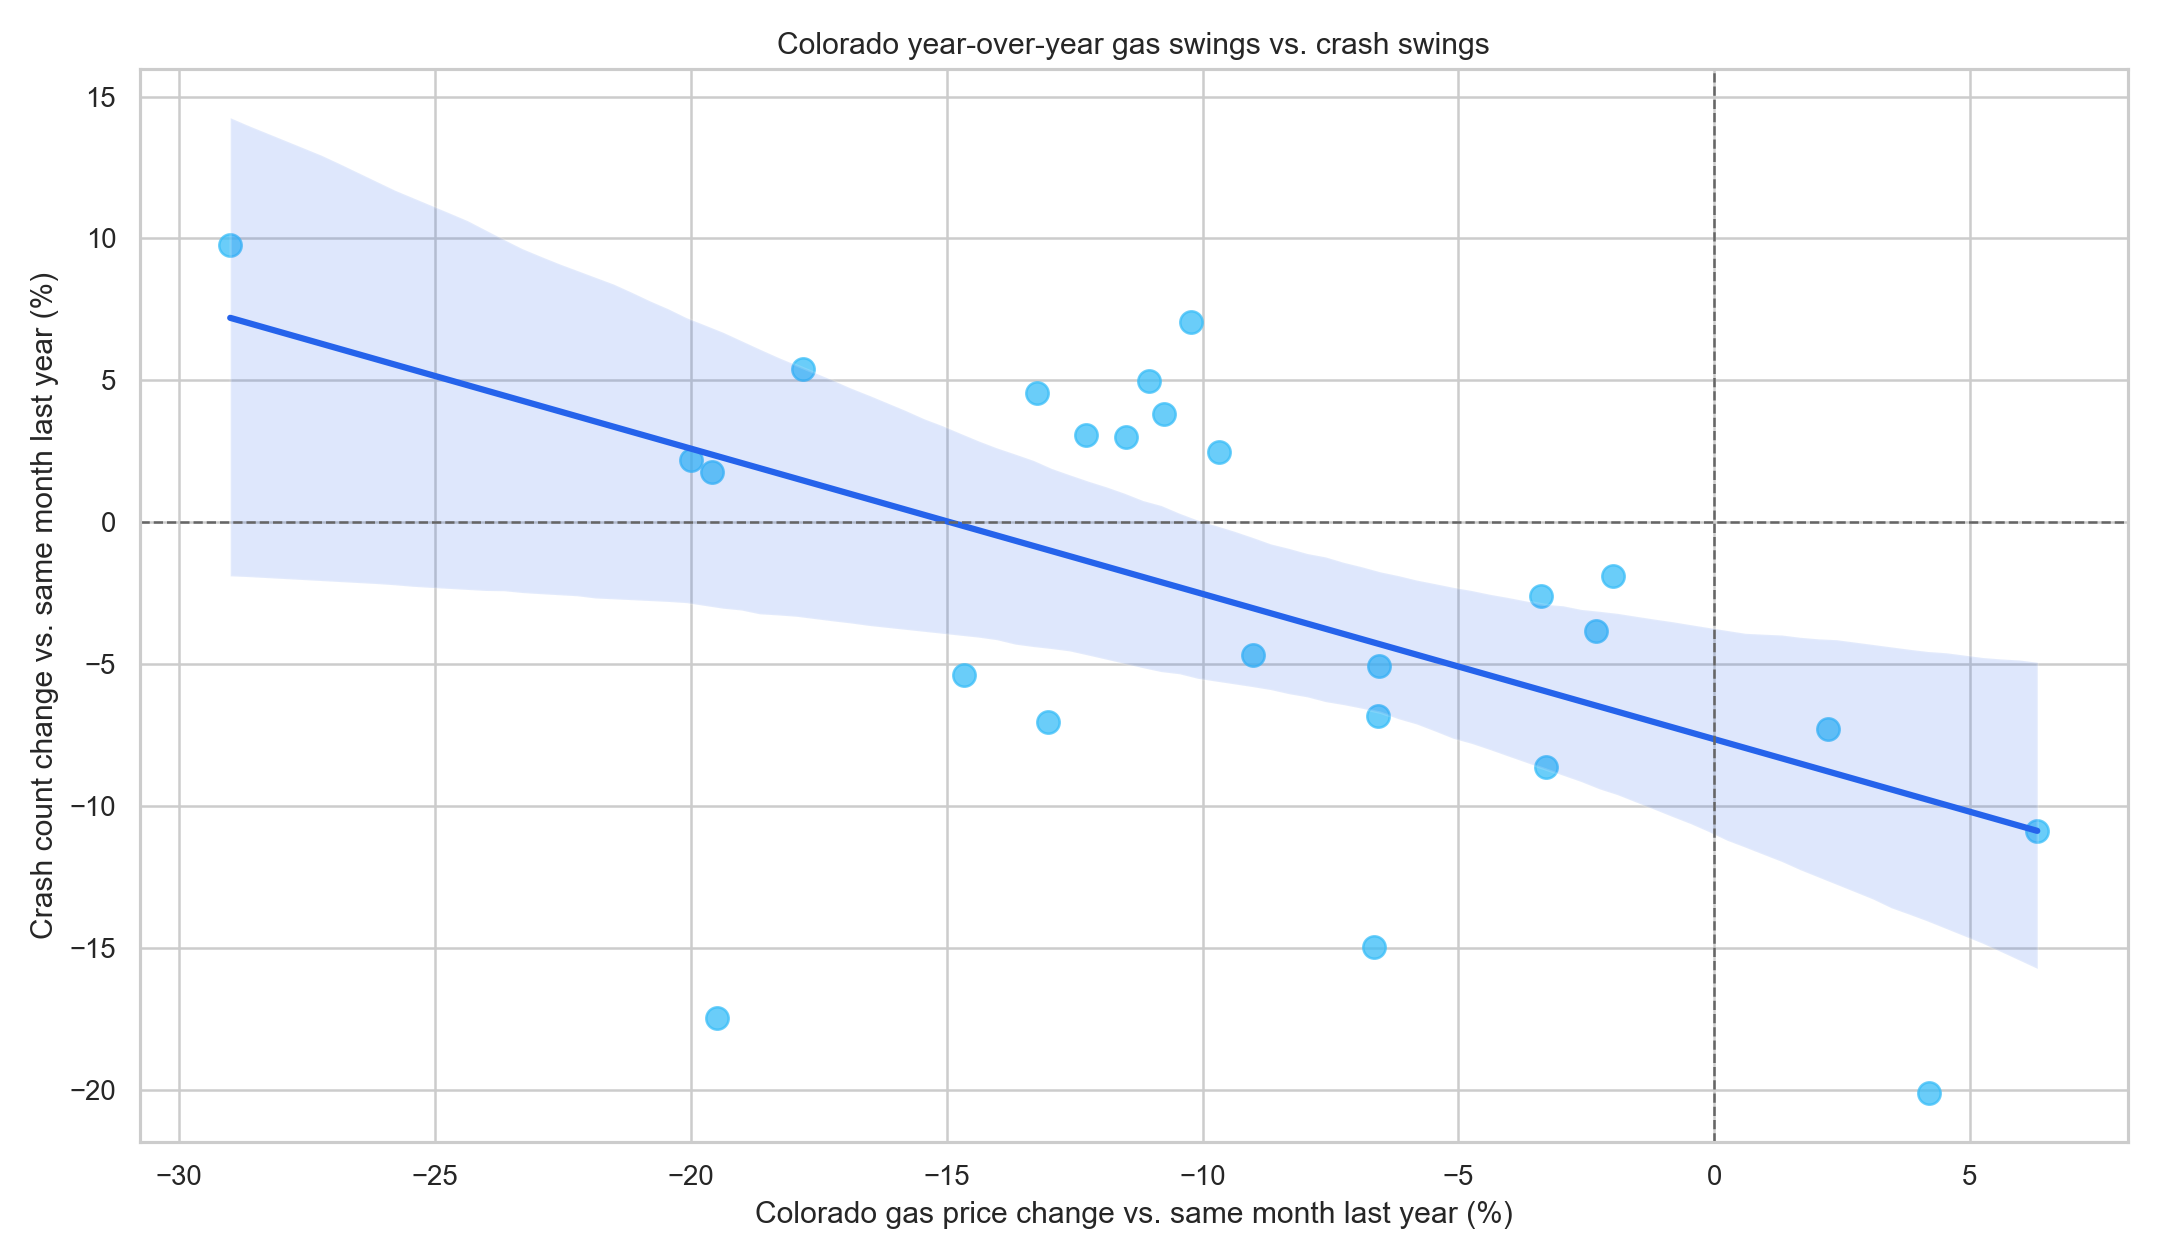
The cleaner relationship is year over year
Comparing each month with the same month a year earlier strips out some seasonality. That is why the year-over-year crash correlation is -0.54, even though the raw same-month views can look muddled.
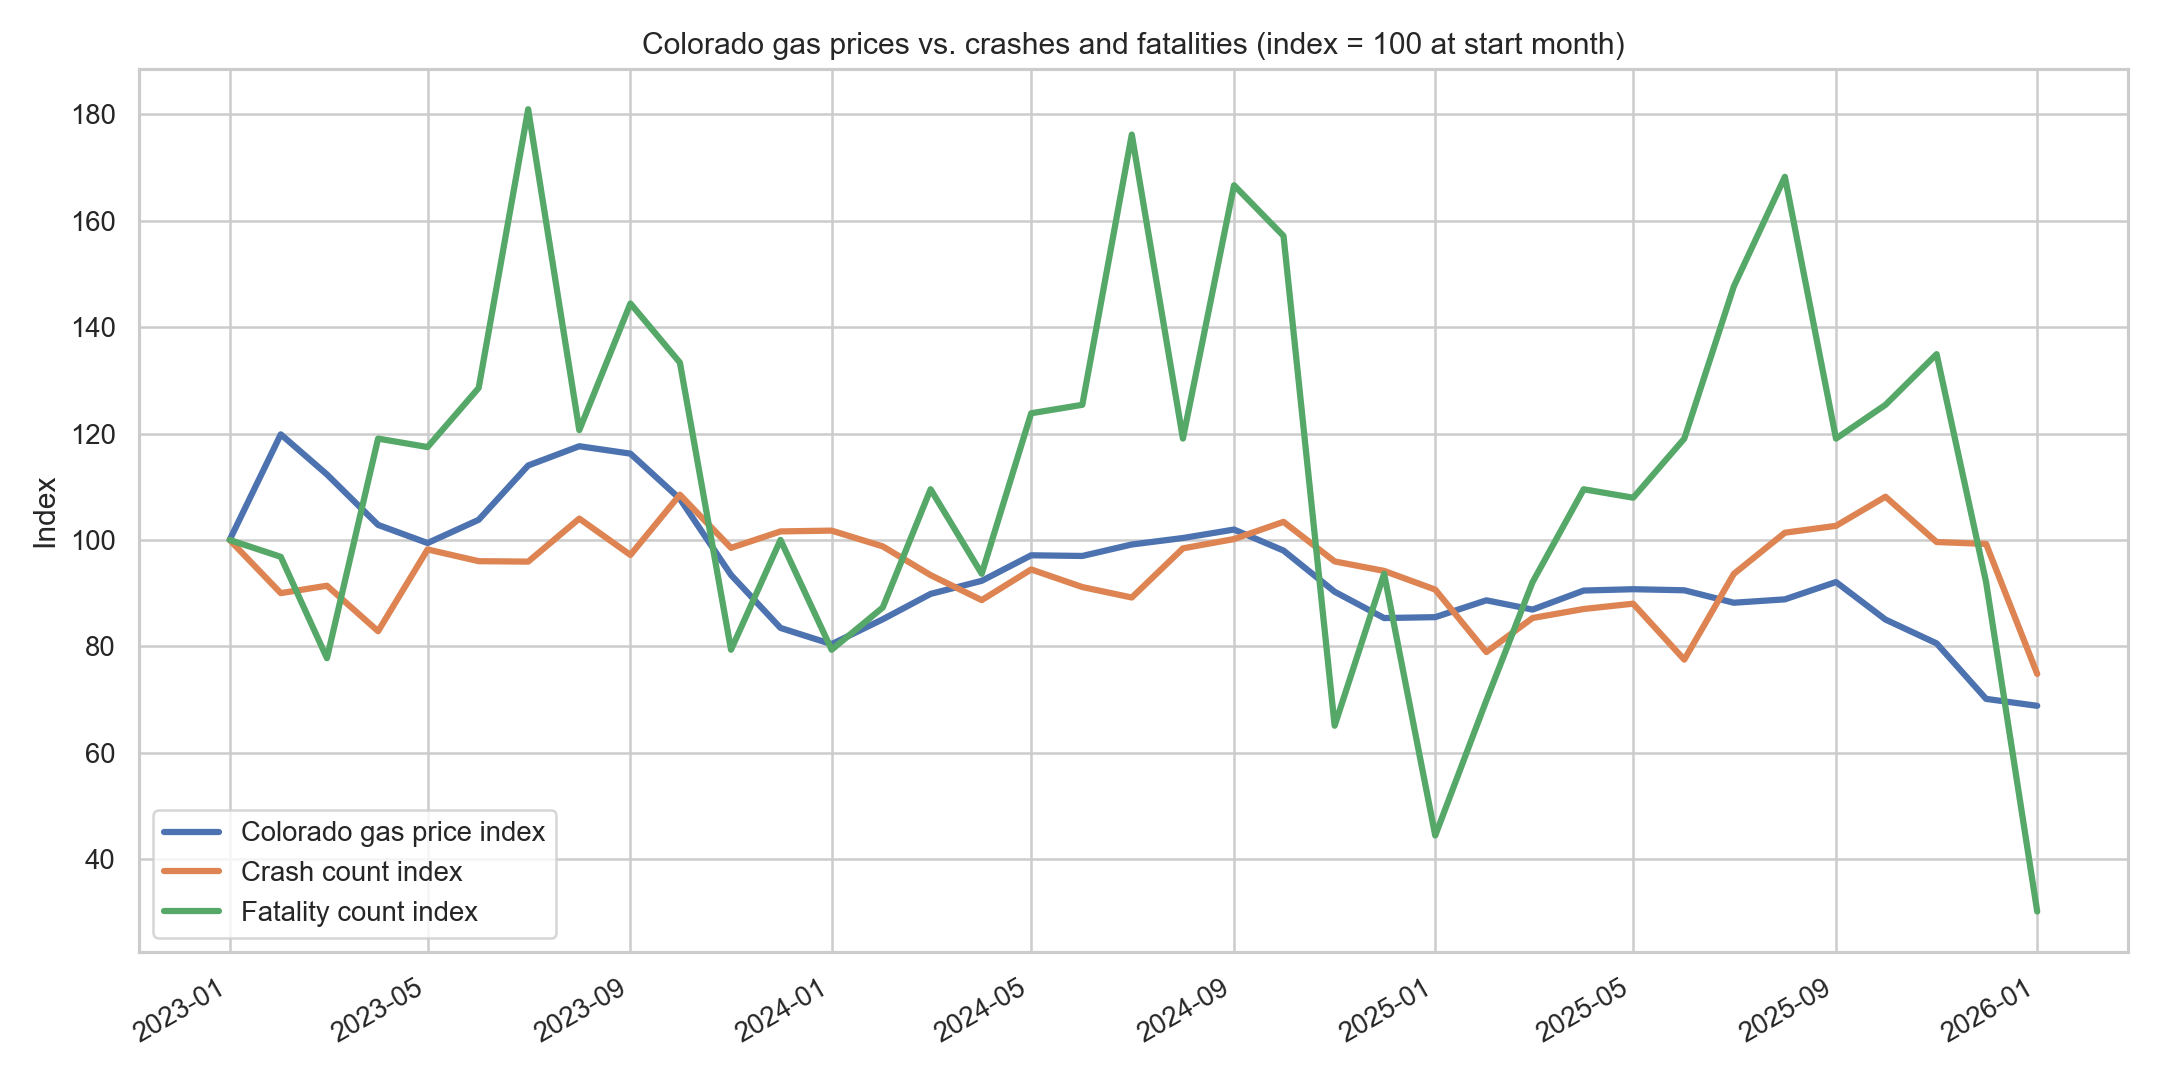
Crash counts soften more clearly than fatalities do
Indexed lines make the asymmetry visible. Crash counts move more smoothly and show a clearer negative pattern than fatalities, which are much noisier month to month.
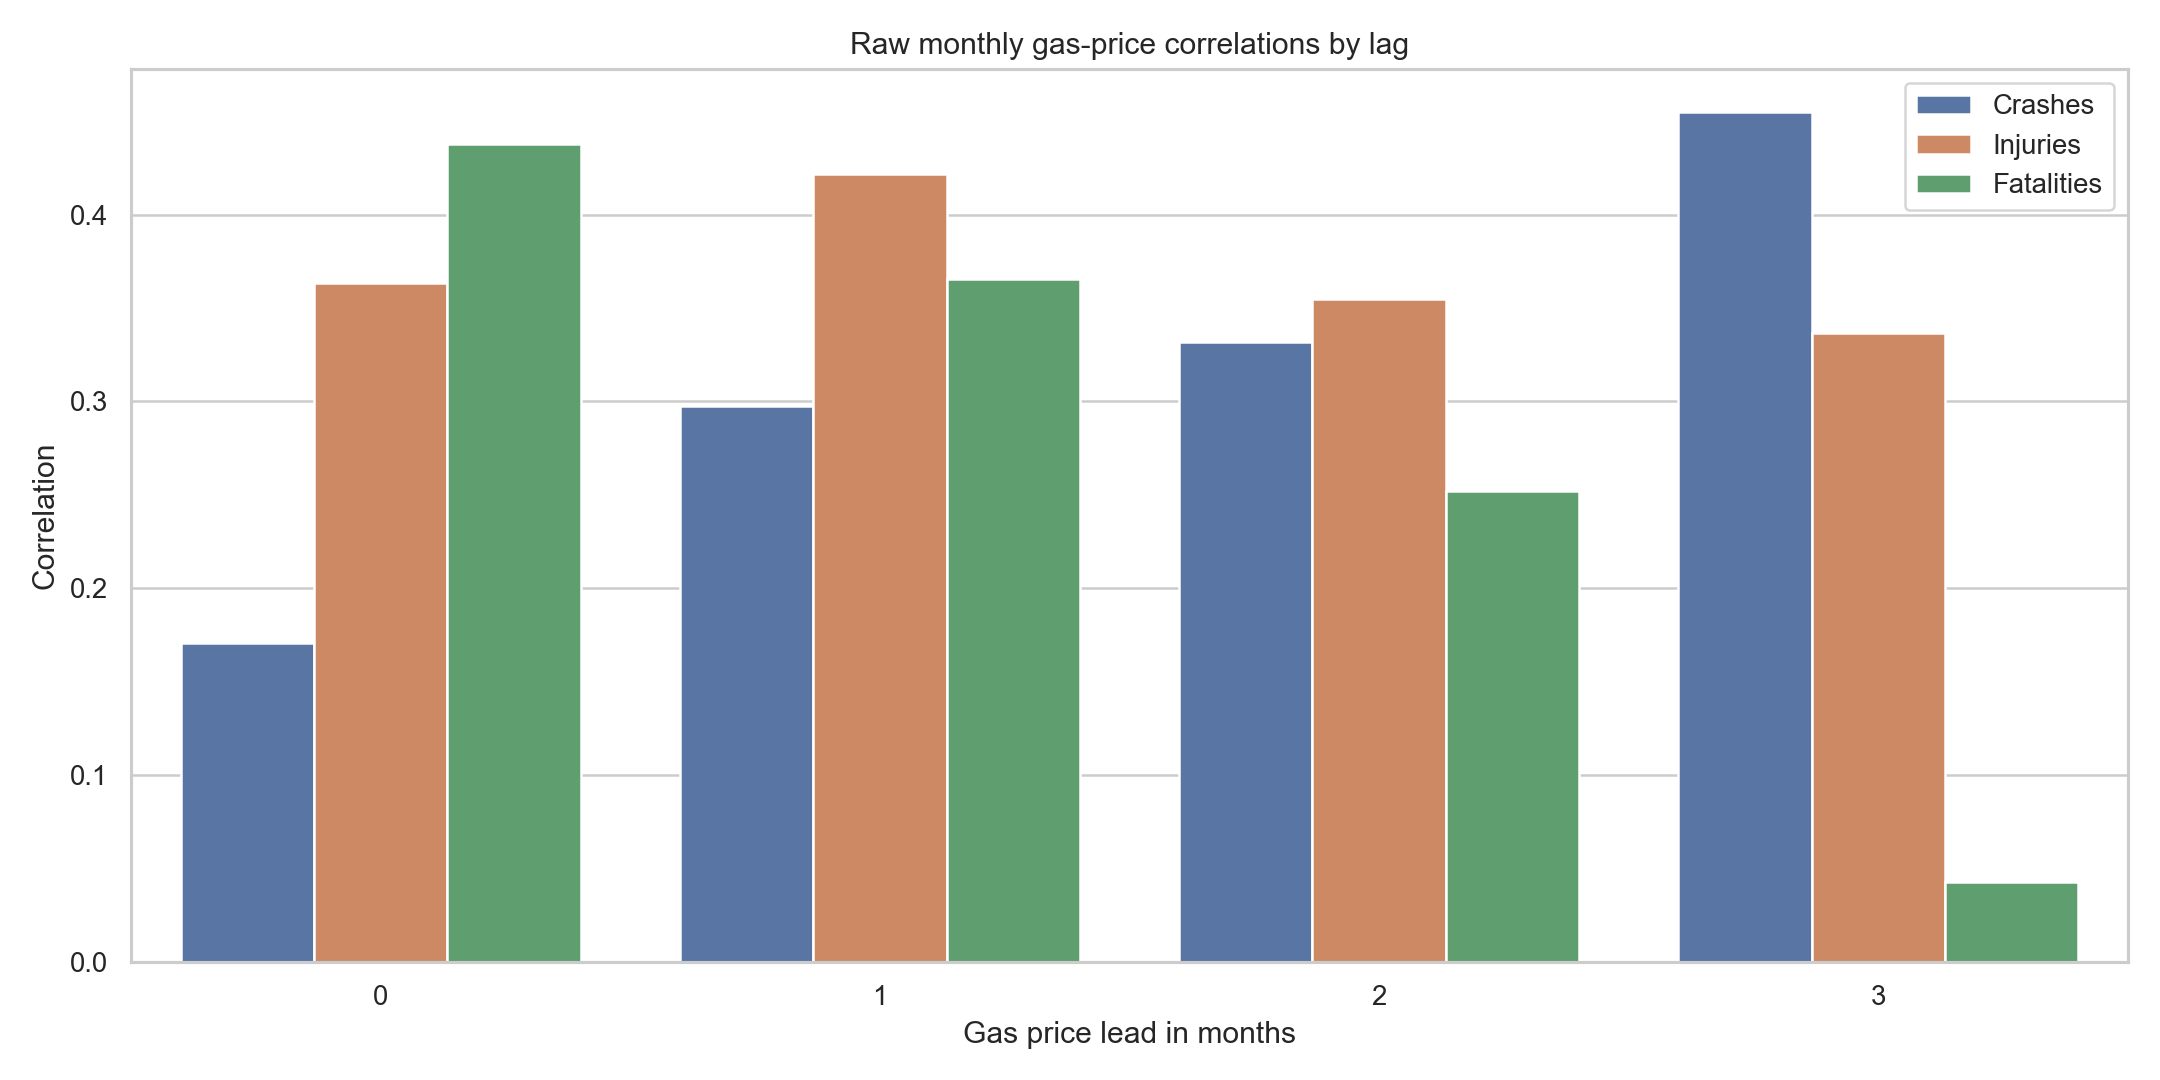
Raw lag correlations are not the final answer
The raw correlations stay positive because seasonality is strong. That does not contradict the adjusted model. It shows why controlling for calendar month matters.
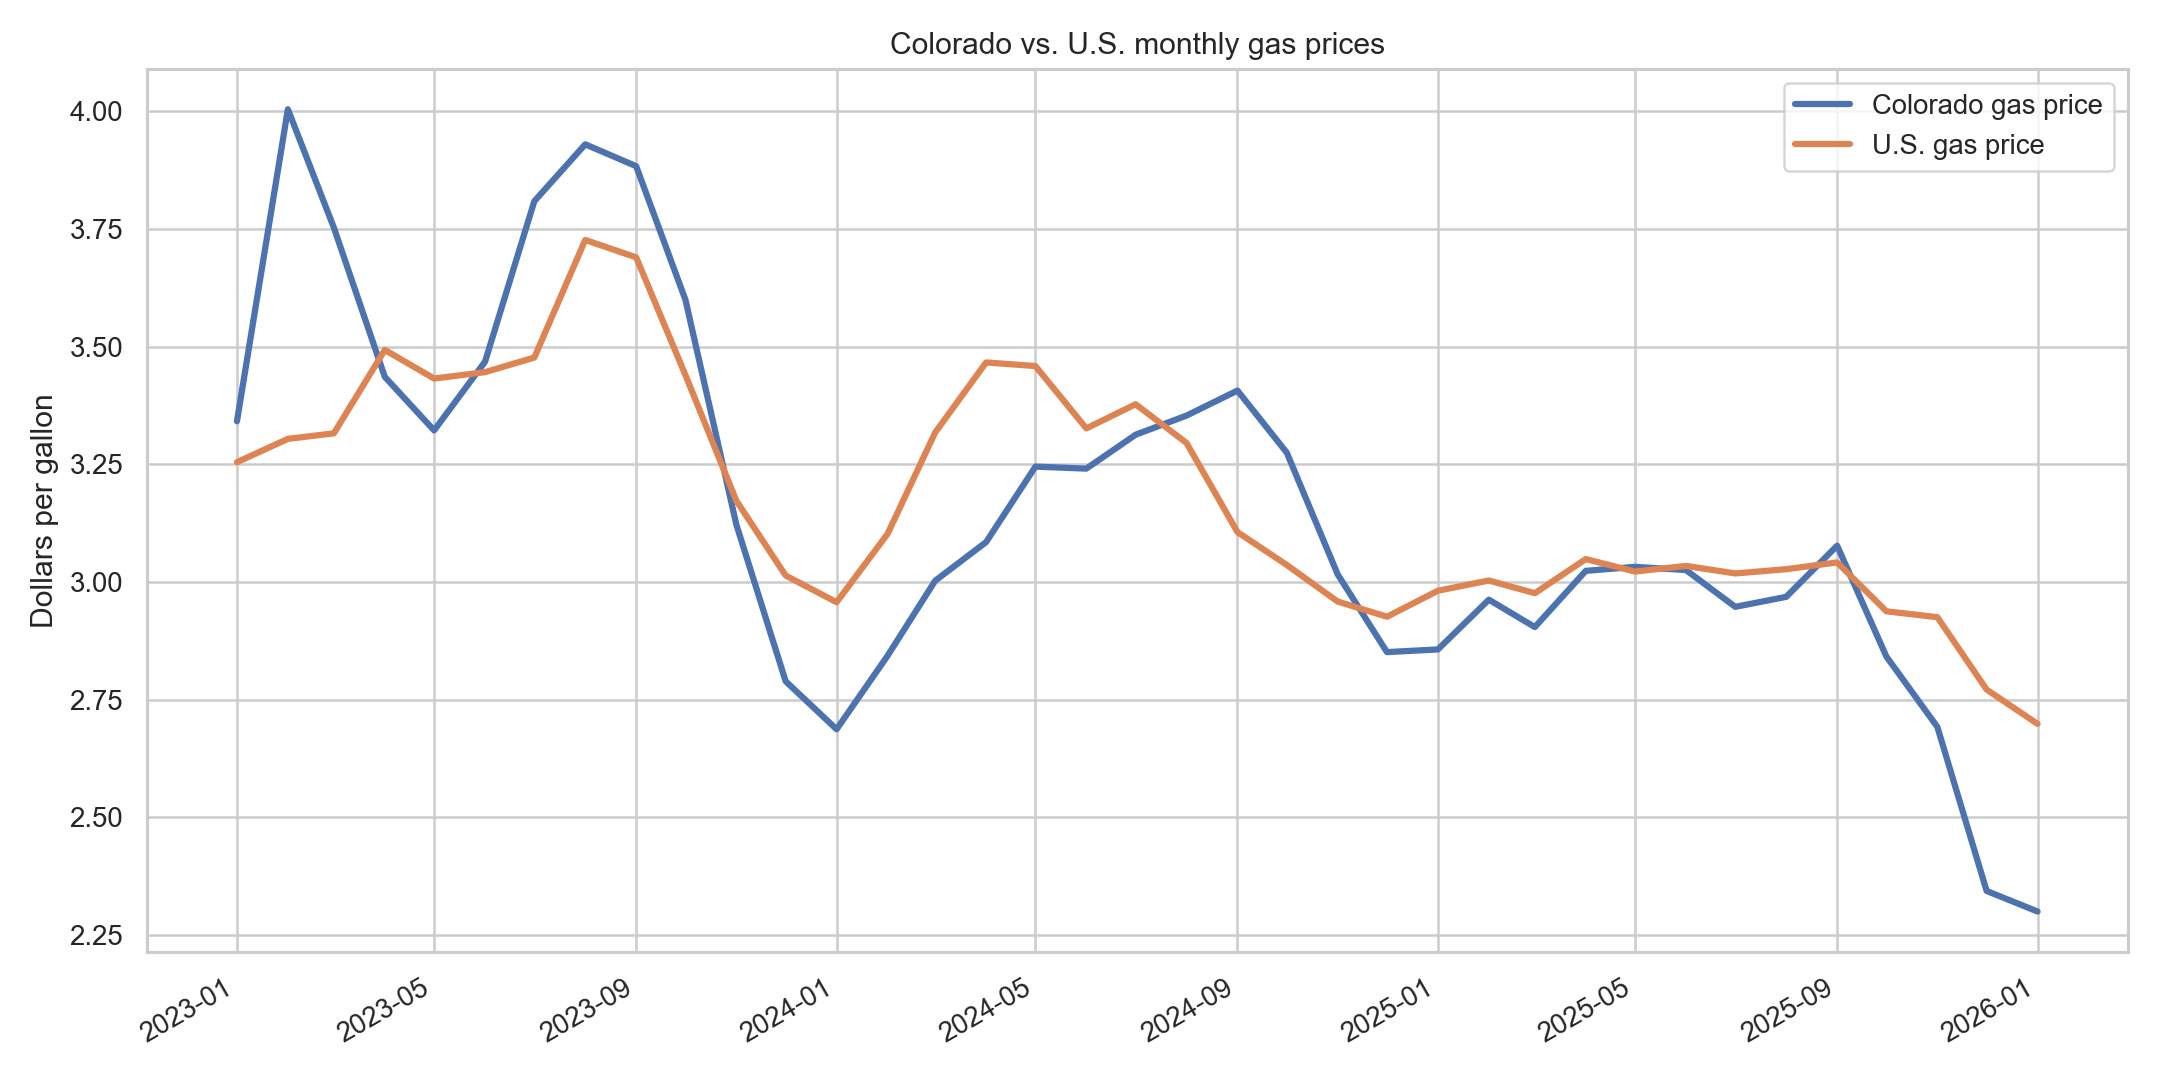
Colorado broadly tracks the national gas story
Colorado usually moves with the national market, but the local line still matters because this page is testing Colorado crashes against Colorado prices.
Lagged 1 month
This month's crashes are compared with last month's gas price. That helps test whether driving changes after people feel the price shock.
Year-over-year change
A month is compared with the same month one year earlier. That reduces the distortion from seasonality, like summer driving and winter weather.
p-value
This is a measure of how surprising the estimate would be if there were really no relationship at all. Lower is stronger evidence, but it is not proof of causation.
R2
This shows how much of the month-to-month variation the model explains. It is about fit, not about whether the relationship is causal.
| Outcome | Model | Change per 10c | p-value | R2 | Months |
|---|---|---|---|---|---|
| Crashes | Same month | -132.48 | 0.002 | 0.725 | 37 |
| Crashes | Lagged 1 month | -175.88 | <0.0001 | 0.7758 | 36 |
| Injuries | Same month | -54.22 | <0.0001 | 0.8663 | 37 |
| Injuries | Lagged 1 month | -63.03 | <0.0001 | 0.8838 | 36 |
| Fatalities | Same month | -0.69 | 0.3341 | 0.758 | 37 |
| Fatalities | Lagged 1 month | -2.35 | 0.0001 | 0.8142 | 36 |
TomTom and Mapbox are useful for station discovery and real-time location workflows, but they are not the historical statewide price backbone for this analysis.
In the current stack, TomTom returned station discovery data but a sample station-ID lookup still came back with HTTP 404. Mapbox returned station metadata but no price fields.
That makes the Energy Information Administration the correct historical source for the price side of this page.
EIA Colorado weekly gas prices
https://www.eia.gov/dnav/pet/hist/LeafHandler.ashx?n=PET&s=EMM_EPMRU_PTE_SCO_DPG&f=W
EIA U.S. weekly gas prices
https://www.eia.gov/dnav/pet/hist/LeafHandler.ashx?n=PET&s=EMM_EPMRU_PTE_NUS_DPG&f=W
EIA gasoline dashboard
https://www.eia.gov/petroleum/gasdiesel/index.php
TomTom Fuel Prices API docs
https://developer.tomtom.com/fuel-prices-api/documentation/fuel-prices-api/fuel-prices-api
TomTom Fuel Prices coverage
https://developer.tomtom.com/fuel-prices-api/coverage/fuel-prices-coverage
Mapbox Search Box category search docs
https://docs.mapbox.com/api/search/search-box/#category-search
Colorado gives the cleanest crash-count story. The national follow-up tests whether the same logic survives when you move to fatality rates and exposure-adjusted data.