Coverage
551
state-year observations across all 50 states and DC
Analyzing Data...
CrashStory paired FARS fatalities with FHWA vehicle miles traveled and EIA state gasoline prices from 2013 through 2023. The honest read is not “gas prices clearly reduce traffic deaths.” It is that the national fatality signal is weak, changes by model, and is not strong enough to headline as a clean causal story.
Coverage
551
state-year observations across all 50 states and DC
State trend read
-0.18%
fatality-rate effect from the broadest within-state over-time model
Strict FE read
+2.12%
the sign flips once you only compare states within the same year
Peak vs trough
1.337 vs 1.347
fatality rate in 2022 versus 2020
The national data do not give CrashStory the same clean headline it has in Colorado. Across 2013 to 2023, the broad state-trend model suggests that a 10% gas-price increase is associated with about -0.18% lower fatality rates, but the evidence is statistically weak.
The problem is not that every national read points the other way. In fact, 80.4% of states have a negative year-over-year gas-vs-fatality-rate correlation. The problem is that the effect is small, noisy, and changes enough by model that it does not support an aggressive national fatality claim.
The honest conclusion is this: higher gas prices may reduce driving enough to cut total crashes, but the national fatality data do not prove that they meaningfully reduce traffic deaths.
The highest gas-price year in this panel is 2022 at 32.41. The lowest is 2020 at 18.01.
Yet the national fatality rate is almost the same in those two years: 1.337 versus 1.347 deaths per 100 million miles traveled.
That is the fastest way to understand why this page is cautious. If gas prices had a large, clean national fatality effect, this comparison would likely look much more dramatic than it does.
The national story is not that nothing is happening. It is that the pattern is mixed: many states lean negative, but the aggregate fatality result is small and model-sensitive.
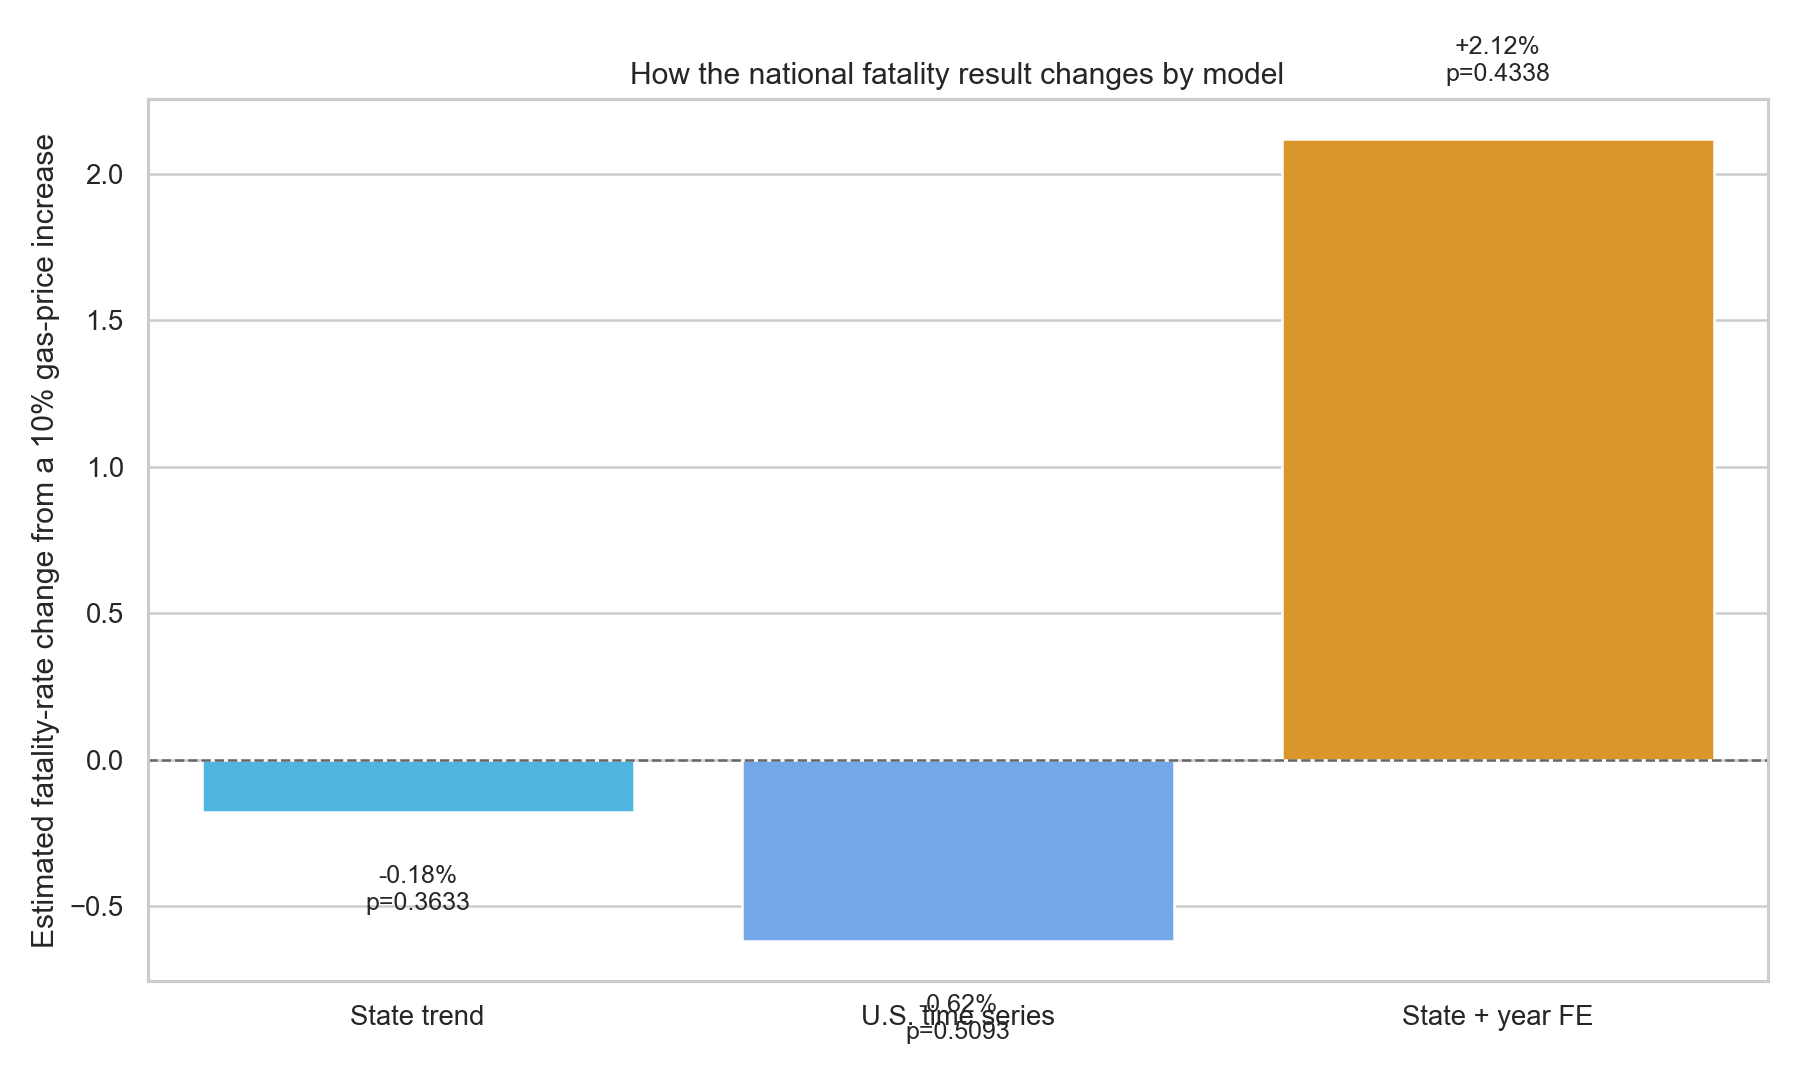
The answer changes by model
This is the core caution chart. Two models lean negative, one flips positive, and none of them are statistically decisive.

The national lines never separate cleanly
Even in the national aggregate, there is no dramatic collapse in fatality rates when gas gets expensive.
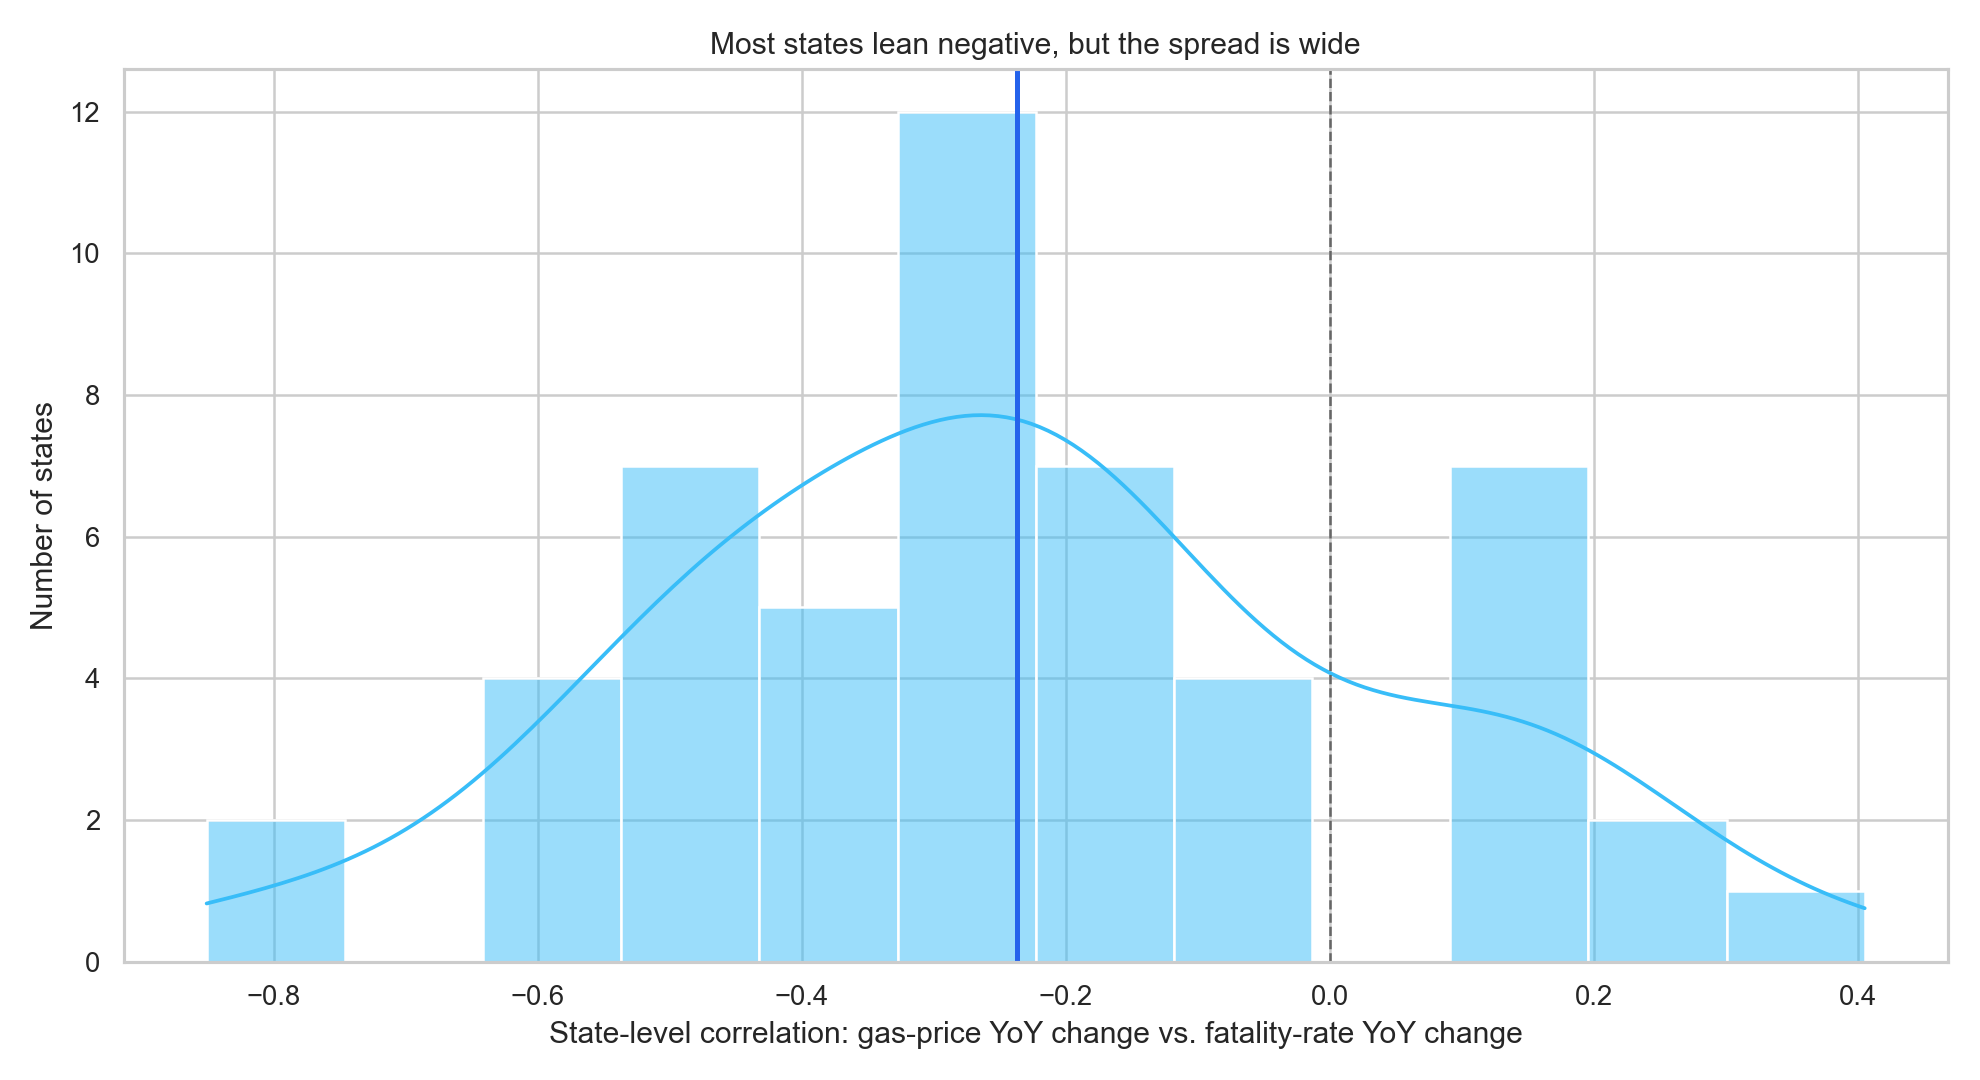
Most states lean negative, but the spread is wide
About 80.4% of states fall on the negative side, but the distribution is broad enough that the overall national read stays weak.

Year-over-year state changes point only weakly downward
The pooled state-year correlation is -0.18, which is a tendency, not a rule.
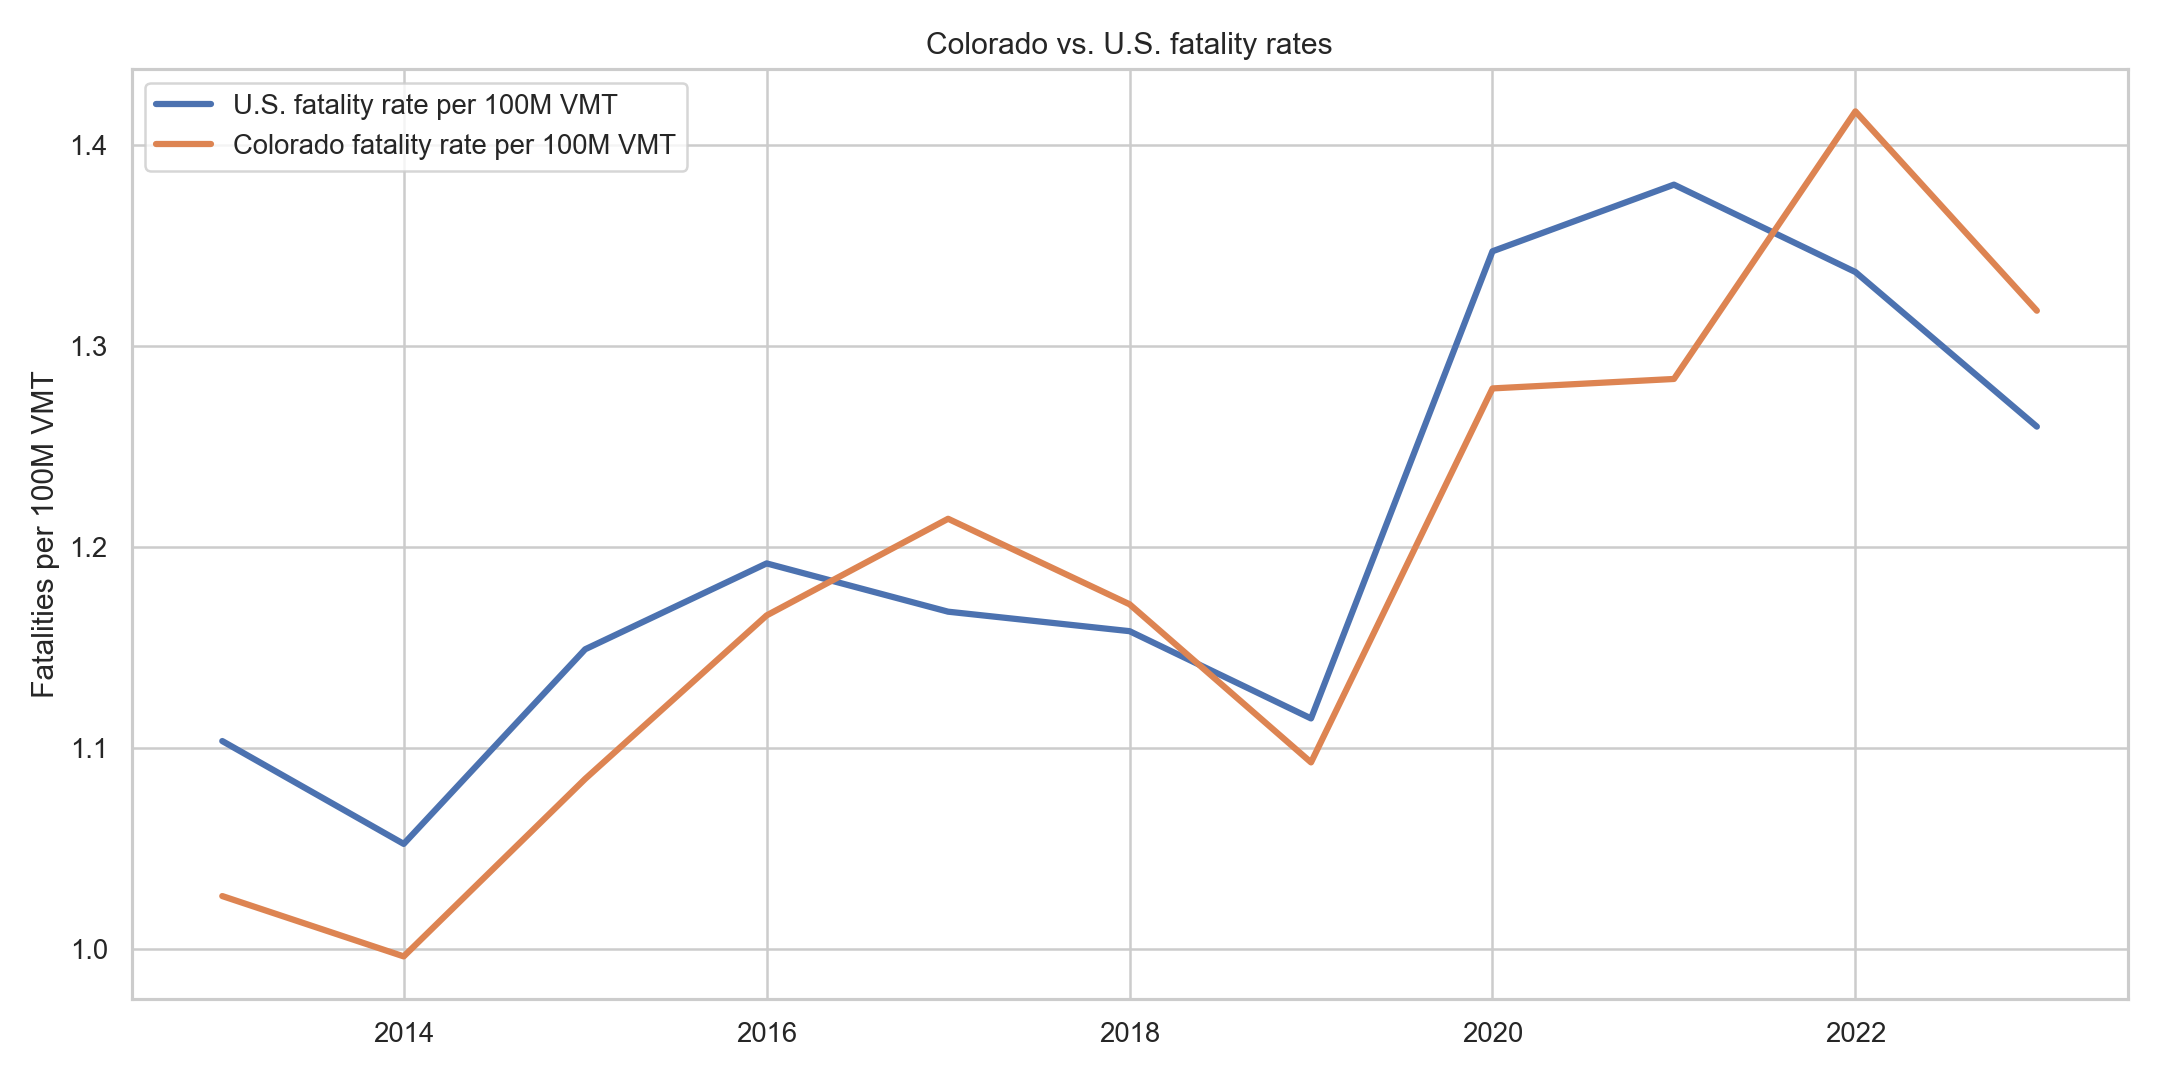
Colorado and the U.S. both remind you this is a different question
Fatality rates have their own dynamics. That is why the national fatality page is a reality check, not a repetition of the Colorado crash-count page.
Do fatality rates usually move lower in a state as gas prices rise over time?
This is the closest national analogue to the Colorado story.
p-value 0.3633 | R2 0.8484 | n 551
Does the national fatality-rate line fall when the national gas-price line rises?
This is intuitive but only has 11 annual observations.
p-value 0.5093 | R2 0.6531 | n 11
Within the same year, do higher-price states have lower fatality rates?
This is stricter, but it is not the same question as a national gas shock.
p-value 0.4338 | R2 0.8813 | n 551
VMT
Vehicle miles traveled. This is the total amount of driving in a state in a year. It lets the analysis look at fatality rates instead of raw deaths alone.
Fatality rate per 100M VMT
How many traffic deaths happen for every 100 million miles driven. This is the exposure-adjusted outcome on this page.
Fixed effects
A way of controlling for persistent differences across states, such as geography, network design, and long-run driving culture.
Annual EIA gas prices
These are state-level annual gasoline prices from EIA in dollars per million Btu, not weekly pump-price snapshots. That is why this page is annual, not monthly.
This page is intentionally harder on the hypothesis than the Colorado page. It uses fatality rates instead of total crashes, annual exposure data instead of monthly counts, and a mix of model families so readers can see where the answer is stable and where it is not.
That is why the page is useful even without a dramatic headline. It shows that CrashStory tested the national version of the story seriously instead of forcing a neat result.
NHTSA FARS information
https://www.nhtsa.gov/research-data/fatality-analysis-reporting-system-fars
FARS 2023 national CSV zip
https://static.nhtsa.gov/nhtsa/downloads/FARS/2023/National/FARS2023NationalCSV.zip
FHWA VM-2 table (2023)
https://www.fhwa.dot.gov/policyinformation/statistics/2023/vm2.cfm
EIA state gasoline prices workbook
https://www.eia.gov/state/seds/sep_sum/html/xls/pr_ex_mg.xlsx
The public-facing headline is still stronger in Colorado, where CrashStory can show a cleaner relationship on total crashes. This national page is the reality check that keeps the overall story honest.